User Guide for Performance Test Visualization Concurrency Chart
This concurrency chart is used to display detailed inference time consumption during performance evaluation, including:
Request-level time consumption display: Detailed processing time for each request, including Prefill stage time consumption, Decode stage time consumption, and total request time consumption.
Real-time concurrency display: Reflects the trend of concurrency changes during the test, helping to evaluate request scheduling and system throughput capabilities.
Core Functions
Granular time consumption analysis: Disassembles the processing process of each request to identify whether performance bottlenecks are concentrated in the Prefill or Decode stage.
Dynamic concurrency visualization: Displays fluctuations in concurrency levels throughout the test, assisting in evaluating the stability and response efficiency of the system under high concurrency pressure.
Support for large-scale request replay: Suitable for high-pressure testing to analyze the performance of models or services under sustained load.
Application Scenarios
Performance optimization: Identifies bottlenecks and provides data support for latency optimization of model inference services, concurrency control, and adjustment of batch processing strategies.
Inference service stress test verification: Conducts stress tests on deployed services to ensure performance meets standards under target concurrency scenarios.
Deployment solution evaluation: Compares the response performance of different models and deployment methods (e.g., local vs. service-oriented) under the same load.
Data Generation Method: When running the performance test command with
--mode perfor--mode perf_viz, the tool will automatically generate an HTML visualization report. Open this file with any mainstream browser to interactively view the detailed time consumption information of each request and the full-process concurrency curve.
I. Basic Interactive Operations
1. View Control
Hover the mouse over the top-right corner of the chart to display the navigation bar.
Navigation Bar Description
From left to right in order
Name |
Icon |
Function |
Legend |
|---|---|---|---|
Download |
Camera |
Captures the current view and saves it in |
|
Zoom |
Magnifying glass |
Enables Zoom mode; see the “Mouse drag canvas” row in the “Mouse Operation Description” table below |
|
Pan |
Crosshair |
Enables Pan mode; see the “Mouse drag canvas” row in the “Mouse Operation Description” table below |
|
Zoom in |
Plus sign |
Zooms in both the upper and lower charts proportionally with the current view as the center |
|
Zoom out |
Minus sign |
Zooms out both the upper and lower charts proportionally with the current view as the center |
|
Autoscale |
Diagonal cross + outer frame at four corners |
Resets the entire chart based on data scale |
|
Reset axes |
House |
Resets the entire chart to initial settings |
|


Mouse Operation Description
Mouse Operation Method |
Chart Effect Description |
Corresponding Icon Name |
Legend |
|---|---|---|---|
Scroll mouse wheel up/down |
On the chart: Scales the display range of the chart at the cursor position; |
Zoom |
|
Double-click left mouse button on the area |
Resets to the default view |
Autoscale |
|
Drag canvas with left mouse button |
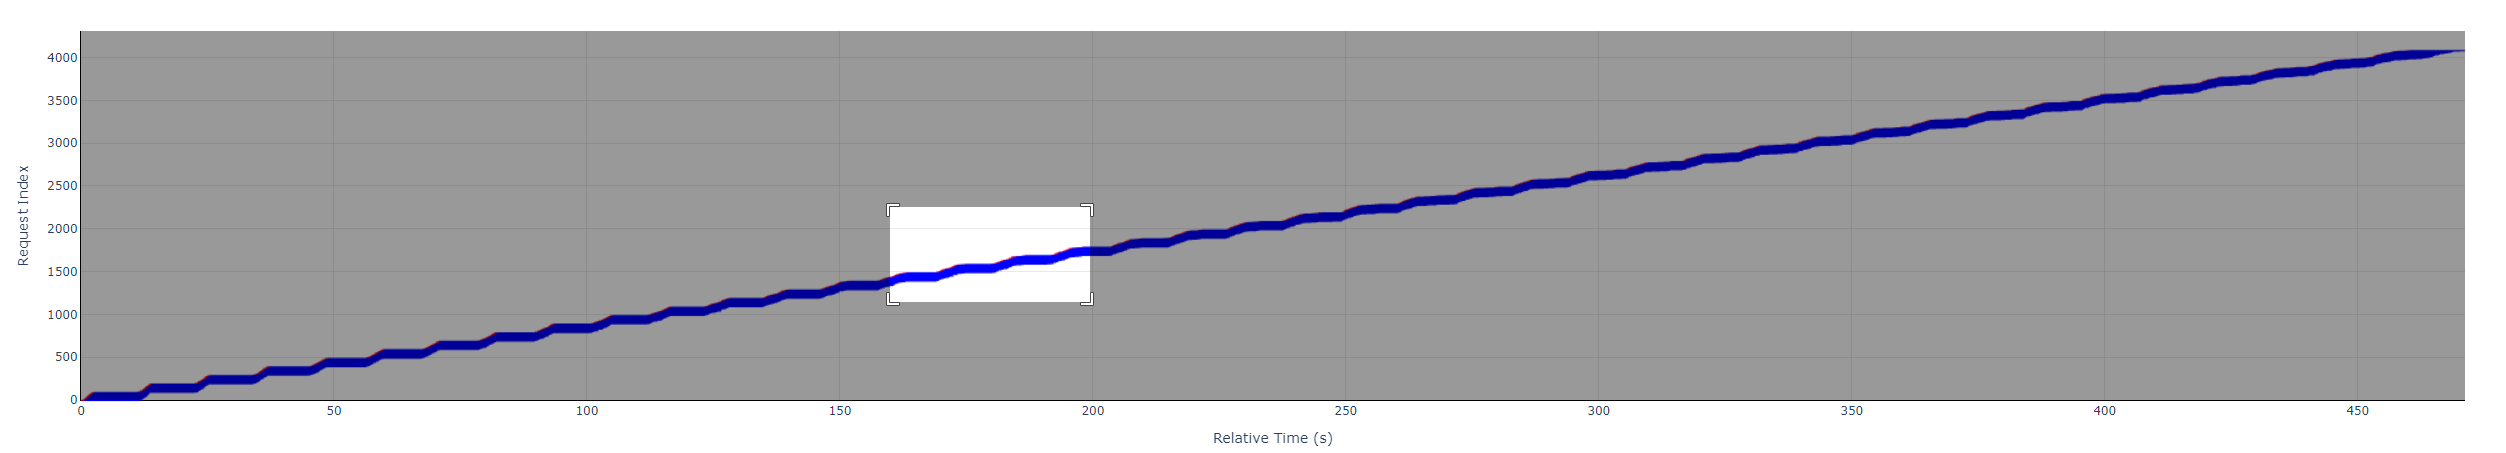
Zoom mode: After selecting the Zoom button in the navigation bar, you can zoom in on the rectangular area selected by mouse drag; |
Zoom, Pan |
Zoom mode: |
2. Data Viewing
Reference Samples
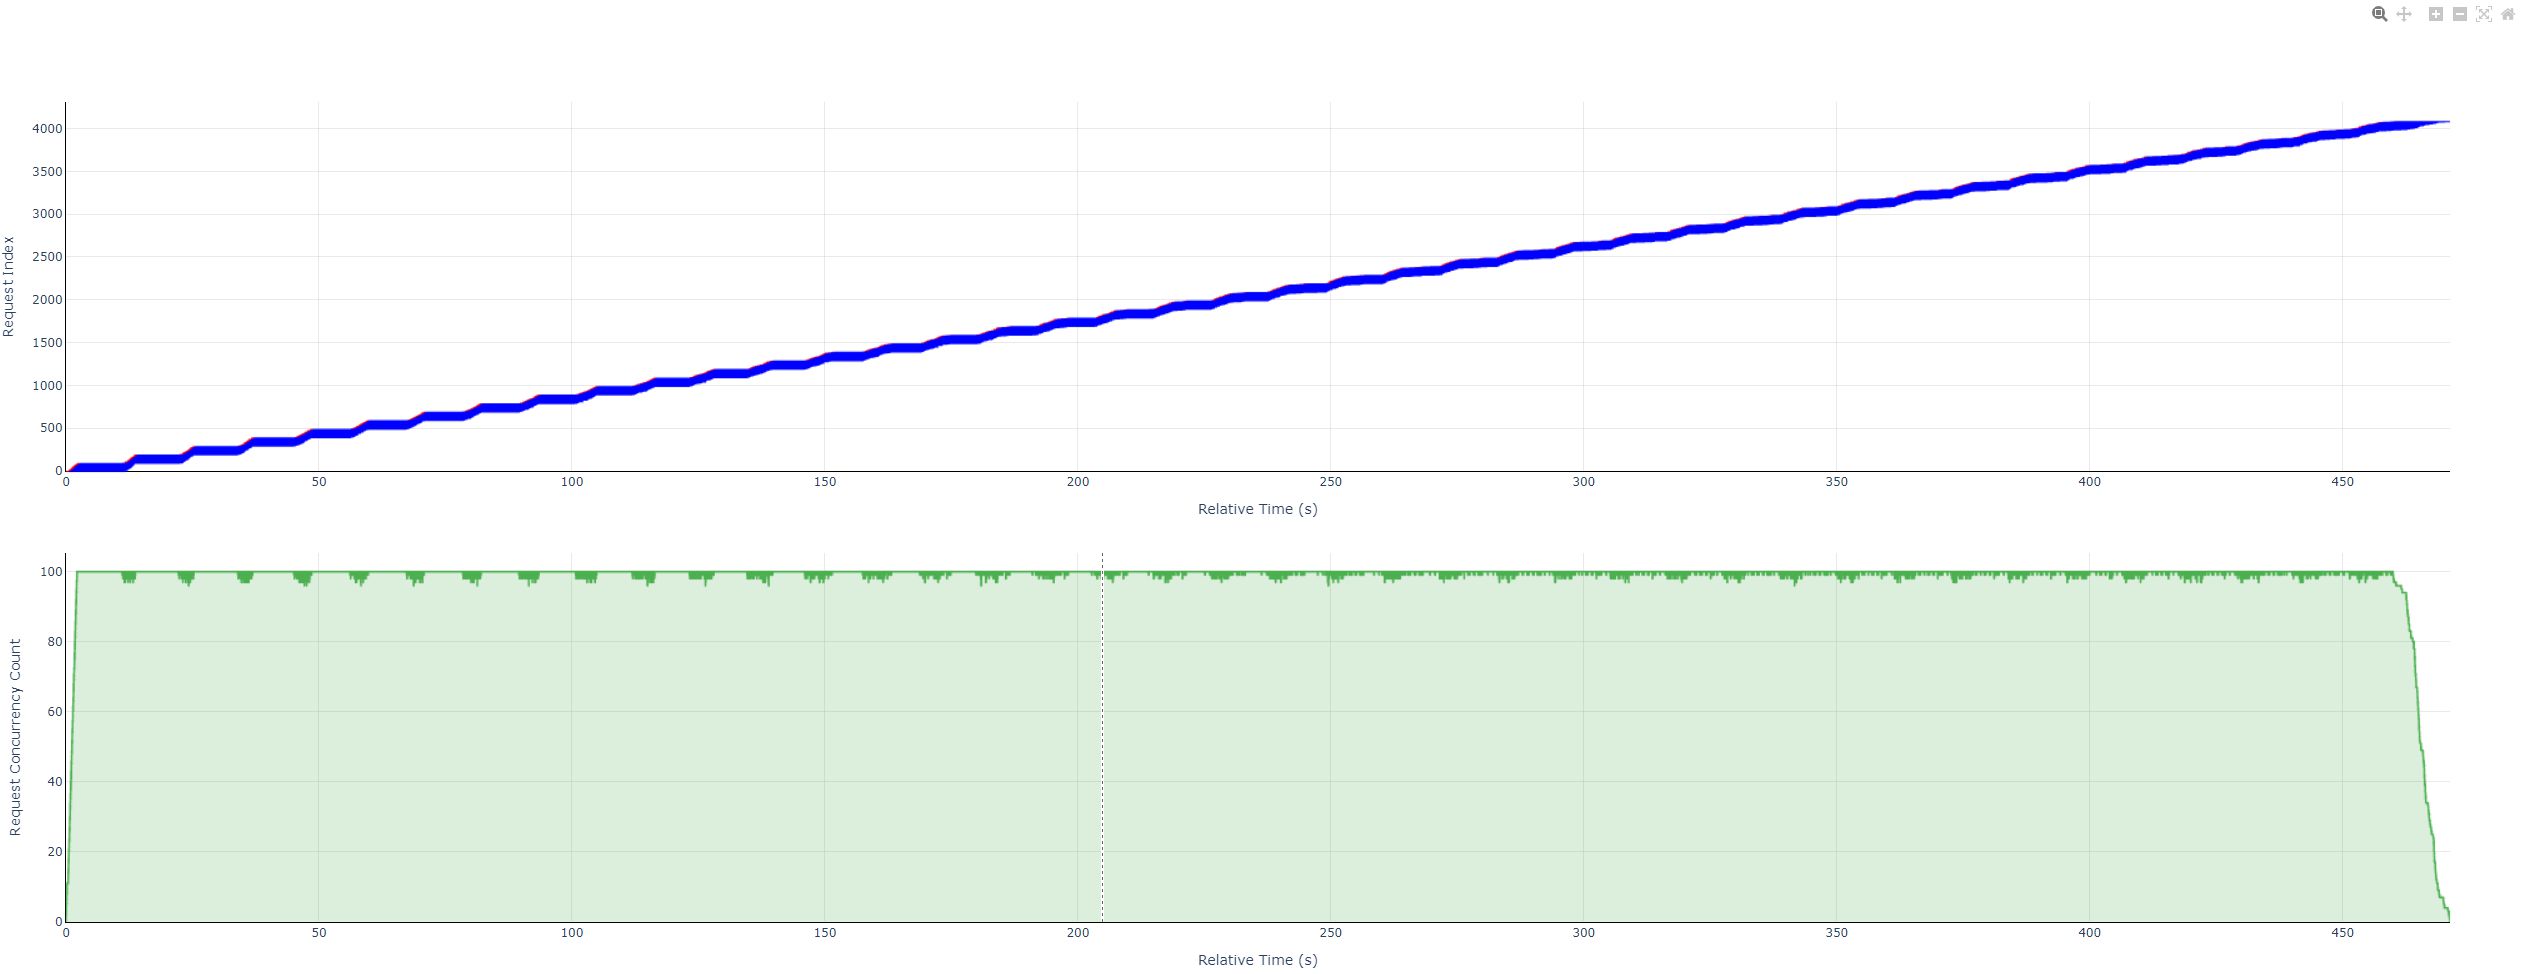
Full Chart Overview
Request Line Chart
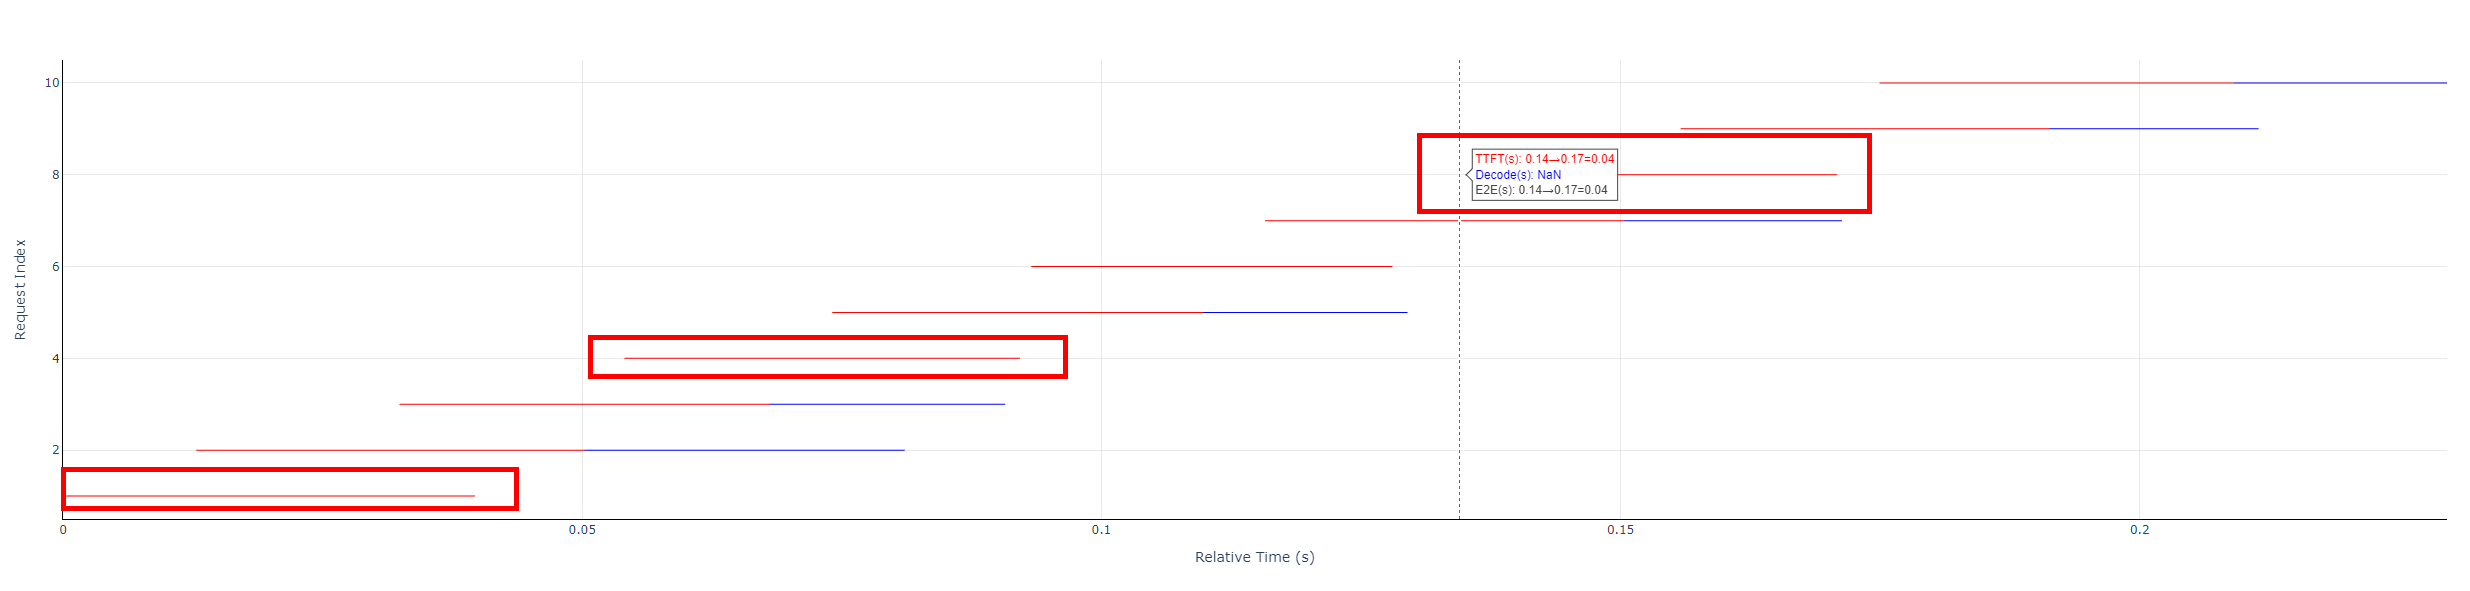
With Decode stage legend
Without Decode stage legend
Concurrency Step Chart
Legend Description and Calculation
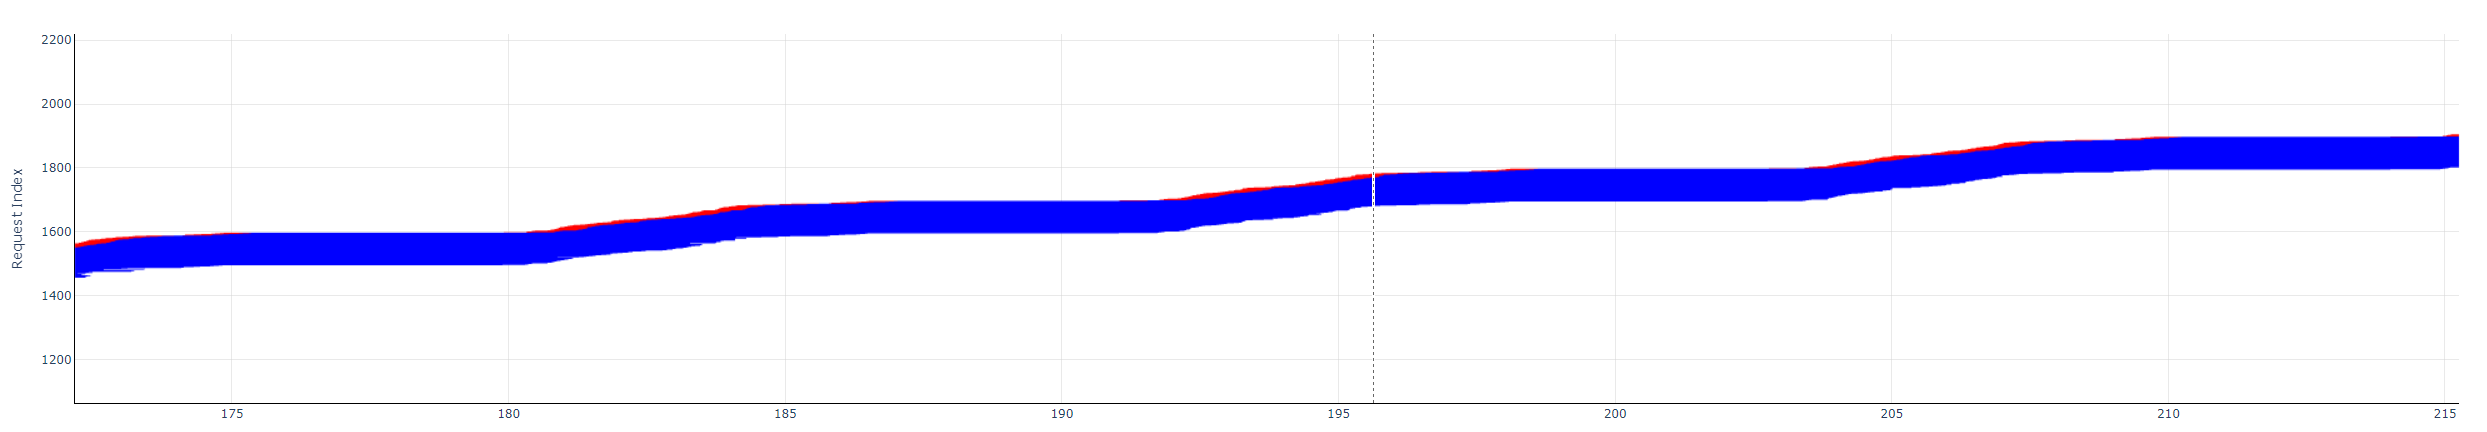
Request Line Chart
Each horizontal line: Consists of red and blue parts, or only the red part, representing the E2EL (End-to-End Latency) of a request.
Red line segment: TTFT (Time To First Token), i.e., latency for the first token.
Blue line segment: Decode, i.e., latency for non-first tokens.
Calculation of values:
TTFT =
prefill_latencyDecode =
end_time- (start_time+prefill_latency)End-to-End Latency (E2EL) =
end_time-start_time
Concurrency Step Chart
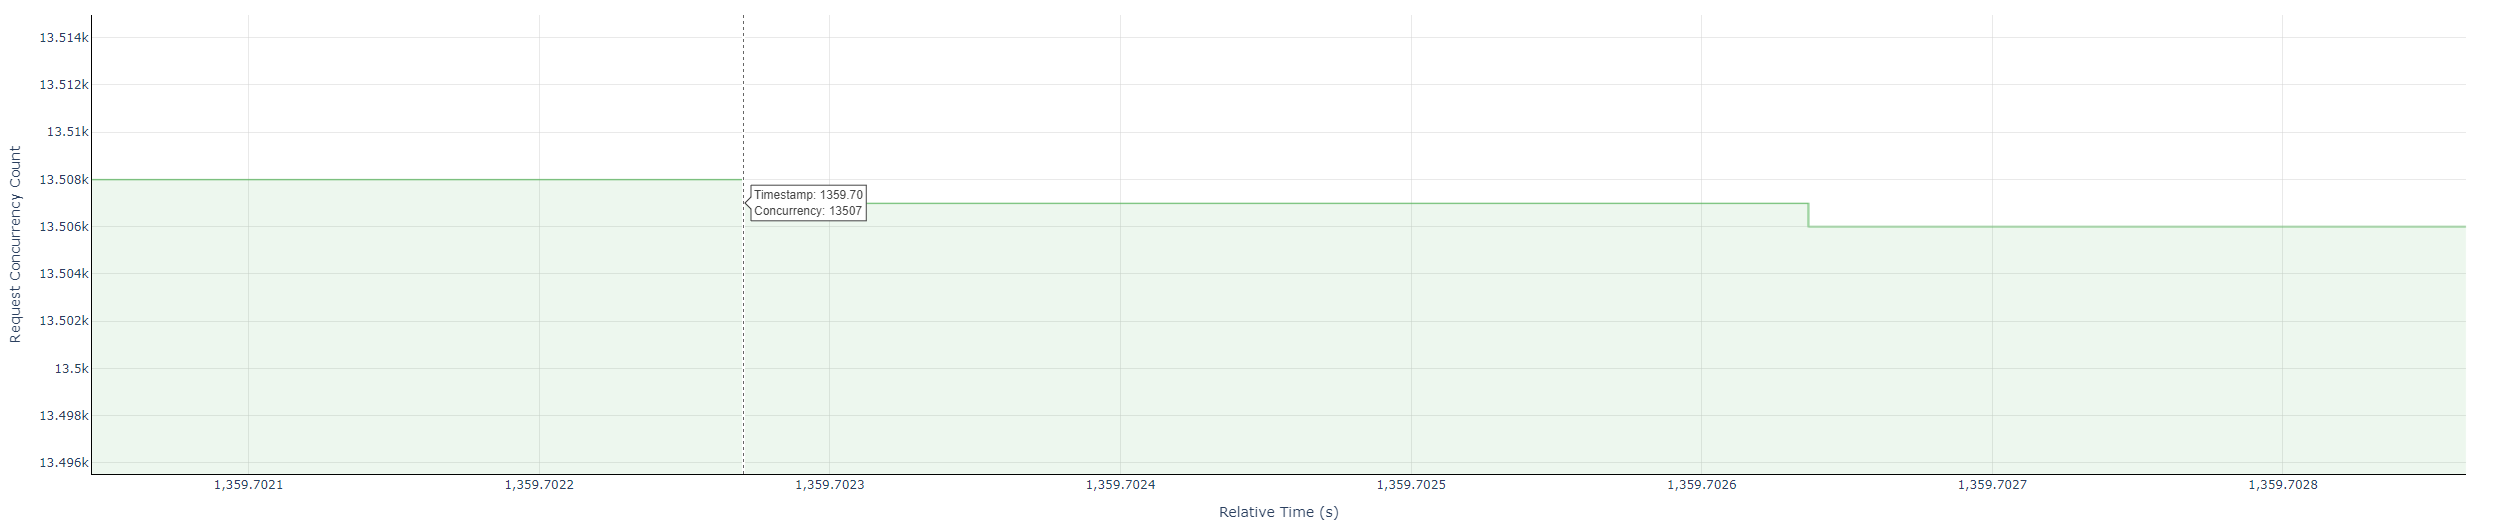
Green line segment: Represents the real-time number of concurrent requests that changes over time.
Calculation of values: Captures the number of requests at the current time point.
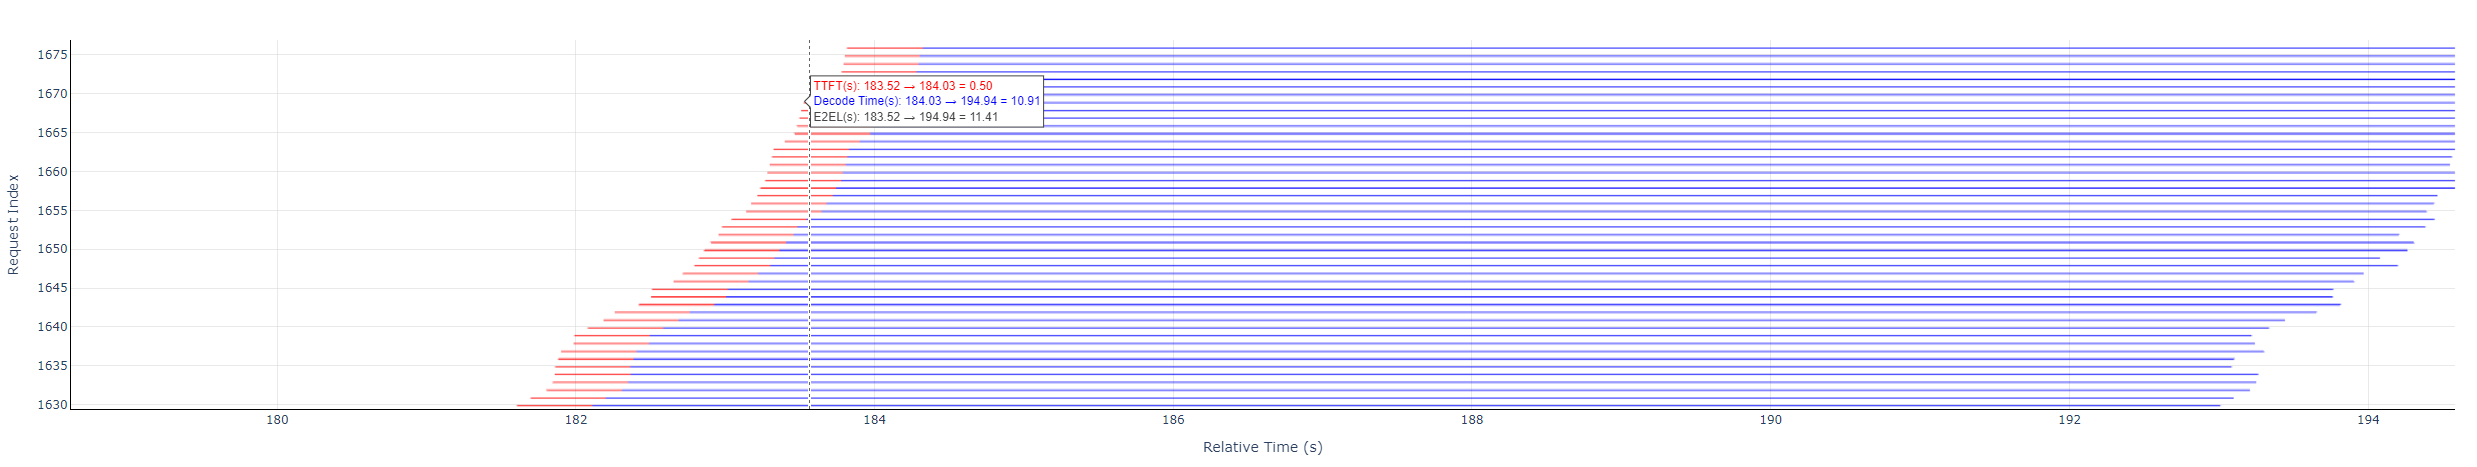
Hover Text Box
Request Line Chart: Hover the cursor near the starting data point of each request line to display: TTFT (Time To First Token), Decode (latency for non-first tokens), and total duration of the request (E2EL).
Concurrency Step Chart: Hover the cursor over the turning point of a new event to display: Timestamp (Time) and Concurrency (number of concurrent requests).
Axis Description
Request Line Chart:
X-axis: Relative timeline, starting point: 0, Unit: seconds (s).
Y-axis: Request index, starting point: 1.
Concurrency Step Chart:
X-axis: Relative timeline, starting point: 0, Unit: seconds (s).
Y-axis: Number of concurrent requests, starting point: 1.
II. Usage of Advanced Functions
Multi-Chart Linkage
The X-axes of the two charts will scale synchronously, while the Y-axes will not (as they have different meanings).
When operating one chart individually, if you need to reference content in the other chart simultaneously, the Y-axis and scaling range of the other chart need to be adjusted separately. For single-dimension scaling, see the “Scroll mouse wheel up/down” row in the “Mouse Operation Description” table above.
III. Cross-Platform Support Description
Application Scenario |
Operation Method |
|---|---|
Web Browser |
Double-click the HTML file to open it directly; supports mainstream browsers such as Chrome, Firefox, and Edge |
Mobile Device |
Supports touch gestures: Pinch to zoom / Swipe to view |
IV. FAQ (Frequently Asked Questions)
Scenario |
Solution |
|---|---|
Chart fails to load |
Ensure JavaScript and WebGL are enabled in the browser; if it still fails to open, try disabling the proxy |
Hover tooltip does not display |
Hover the mouse over the data point where the time changes, rather than swiping quickly or pausing at the turning point of an old event |
View lags |
Reduce data density or narrow the view range |
Mobile device operation |
Use two fingers to pinch and zoom + swipe with one finger to adjust |
No additional buttons are required for all interactive functions.
The operation status bar is displayed in the top-right corner of the chart.
The chart is fully compatible with the latest versions of mainstream browsers (Chrome, Firefox, Edge).